When window stickers land, official government figures tell one story. On paper, the new Rivian R2 Performance matches Tesla’s Model Y Performance on combined EPA efficiency ratings at 105 MPGe and 32 kWh per 100 miles. Rivian CEO RJ Scaringe even touted that the R2 equals the Model Y on energy consumption.
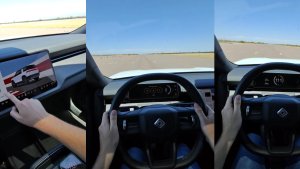
However, laboratory EPA cycles rarely reflect everyday driving conditions, which vary greatly in speed across each session and often include a mix of highway and city roads. A real-world efficiency test reported by Electrek and originally conducted by Out of Spec Reviews put both performance electric SUVs head-to-head on the road. The side-by-side test revealed that the R2 used between 18% and 26% more energy across every single speed tested.
As Rivian R2 customer deliveries officially began last month, seeing real-world numbers fall behind official claims highlights the gap between EPA testing and everyday driving.

Comparing On-Paper Specifications
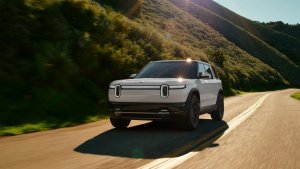
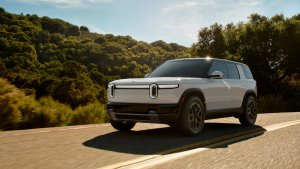
The R2 serves as Rivian’s first mass-market play, directly targeting the Model Y (check out our full comparison of the Model Y and R2). It features a heavier chassis and a boxier, more utility-focused shape than Tesla’s aerodynamic crossover. The R2 Performance acts as Rivian’s flagship trim, lining up directly against Tesla’s top-tier Model Y Performance before other variants like the R2 Premium and R2 Standard debut to take on Tesla’s more affordable offerings.
Feature | Rivian R2 Performance | 2026 Tesla Model Y Performance |
|---|---|---|
Starting Price | $57,990 | $57,990 |
Drivetrain | Dual-Motor AWD | Dual-Motor AWD |
Range (EPA-est.) | 330 miles | 306 miles |
Horsepower | 656 hp | 510 hp |
Torque | 609 lb-ft | 513 lb-ft (estimated) |
0–60 mph | 3.6 sec | 3.3 sec |
Ground Clearance | 9.6 in | 6.0 in |
Payload | 1,168 lb | 1,124 lb |
Towing Capacity | 4,400 lb | 3,500 lb |
Battery Size | 87.9 kWh | 81 kWh |
Real-World Efficiency Head-to-Head
To eliminate variables during testing, both SUVs were prepped under strict methodology: tires set to 42 PSI cold, climate set to 68°F on auto, two occupants per vehicle, screens dimmed, and no phone charging. The R2 ran in Conserve mode while the Model Y ran in Chill mode, swapping lead positions on out-and-back highway loops to prevent drafting advantages.
Speed / Test Scenario | Rivian R2 Efficiency | R2 Energy Consumption vs. Model Y |
|---|---|---|
50 mph | 4.00 mi/kWh | 18.4% more energy used |
60 mph | 3.15 mi/kWh | 26.0% more energy used |
70 mph (I-95 Traffic) | 3.06 mi/kWh | 20.0% more energy used |
80 mph | 2.46 mi/kWh | 26.5% more energy used |
City Simulation (20 min) | 1.9 kWh consumed | 18.8% more energy used |
Notably, even in the city scenario built to favor Rivian’s front-motor mechanical decoupling, the Model Y used only 1.6 kWh over 20 minutes compared to 1.9 kWh for the R2. Watch Out of Spec Reviews’ full efficiency test below:
Charging Speeds and Highway Cruising
Where the R2 Performance makes up ground is charging performance. During a 15-minute 10% charge test, the R2 held 600 amps all the way to a 32% state of charge, peaking around 229 kW of power draw and adding a total of 48.3 kWh.
Out of Spec Reviews also put both vehicles through its “10% Challenge,” where each vehicle was charged from 10% for exactly 15 minutes, and then driven at 80 mph until it came back down to 10%. The R2 Performance only managed to drive 2.2 mi/kWh at 80 mph, covering 92.8 miles before the battery hit 10% again.
By comparison, the Model Y Performance managed 103 miles at 3.3 mi/kWh on less total added energy. While the R2 charges faster at the plug, Tesla’s aerodynamic profile and lighter weight keep it ahead on cruising efficiency. You can check out Out of Spec Reviews’ full “10% Challenge” below: